Abbreviations
HMICFRS Her Majesty’s Inspectorate of Constabulary and Fire and Rescue Services
HRDP Human Resources Distribution Plan
PBR Priority Based Resourcing
PSNI Police Service of Northern Ireland
Executive Summary
Introduction and background
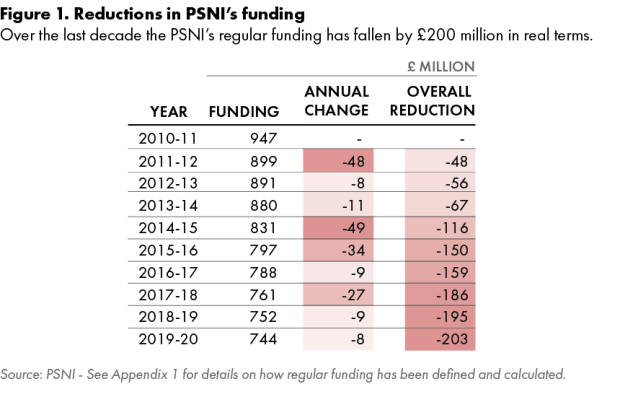
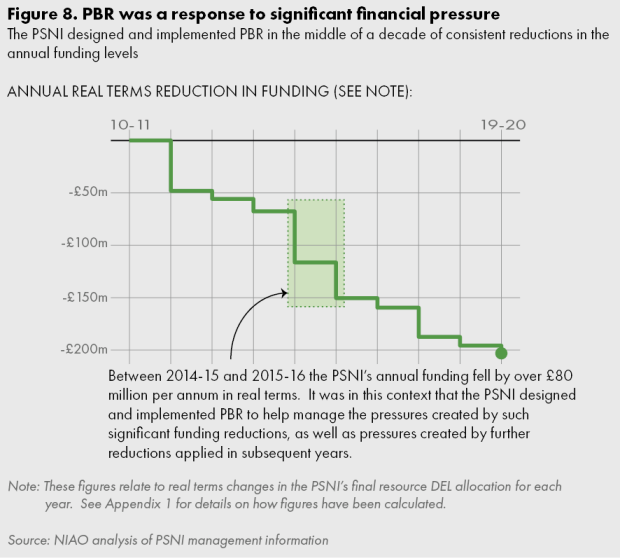
The Police Service of Northern Ireland’s (PSNI) annual funding reduced by 20 per cent between 2010-11 and 2019-20, around £200 million in real terms. This reduction was more severe than that experienced by most English and Welsh police services over the same period. While others have used financial reserves to offset year on year reductions, the PSNI has been unable to use this source of funding due to the unique budgeting arrangements in Northern Ireland. Consequently, dealing with funding reductions has been challenging for the PSNI.
Over this same period, the demands for policing grew in a number of different ways. The number of incidents reported by the public increased markedly. There was also a significant change in the profile of the crimes investigated that placed an additional demand on resources.
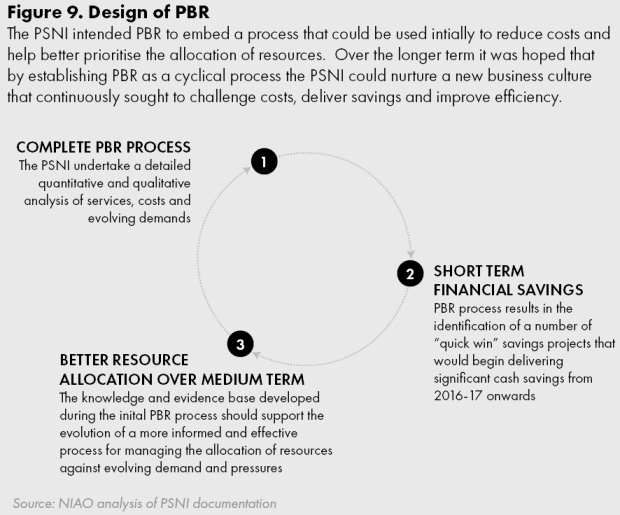
In response, the PSNI implemented two major business transformation programmes. Between 2011 and 2015, in cooperation with an external partner, the PSNI designed and implemented the ServiceFirst programme which involved transforming a number of organisational processes to improve efficiency. Then, between 2015 and 2019, a cost reduction and business transformation methodology called Priority Based Resourcing (PBR) was implemented. PBR was designed to help better manage financial and operational pressures. It essentially involved an intensive analysis of the full range of activities carried out by the PSNI and the costs which arose from that activity, in order to:
- identify “quick wins”, savings proposals that could be implemented quickly to help ease financial pressures resulting from decreases in funding levels; and
- help support the development of a more evidence-based decision making approach to re-allocating resources within the organisation, in response to changes in demand for policing.
Conclusion
Despite the prolonged reductions in funding and the corresponding reductions in the size of the workforce, both crime outcome rates and confidence in the PSNI have remained stable over the last decade. It was anticipated that PBR would develop and embed a new culture, which would challenge costs and lead to optimal utilisation of resources. However, PBR did not deliver the strategic change to the business of policing that was anticipated. Although it undoubtedly made a contribution to a more efficient allocation of resources, the nature of the contribution is difficult to quantify. Further, the way in which the PSNI responded to financial constraints has significant implications for long term sustainability and service delivery.
There has been no comprehensive assessment to determine that the changes made during the PBR period represent genuine long-term efficiencies. This would require a process that monitored the impact of the changes made over a sustained period, quantifying the benefits derived and validating that these benefits had been sustained over a reasonable period of time. Without this, the PSNI cannot demonstrate that PBR has delivered value for money.
The PSNI plans to implement a new interim efficiency programme. This programme will adopt a different approach, to be approved through the PSNI’s Service Change Board. The PSNI recognises the need to learn from the experience gained during 2015 to 2019.
Key issues
The PSNI implemented PBR without fully understanding how it would work
The business case which supported PBR was flawed in a number of ways:
- it did not demonstrate that the PSNI fully understood PBR or that it had a clear vision of the specific objectives that the programme would achieve;
- it was expected to deliver savings in the region of £4 million per year, although this expectation was not integrated into either the project outputs or expected benefits and was not used as a target against which to measure progress; and
- it lacked a detailed timeframe without key milestones for delivery and realisation of benefits.
Consequently, project delays and changes to the scope became inevitable. Of the 14 projects initiated in late 2017, three were completed with substantial changes in scope. A number were subject to significant changes, while others were abandoned.
The implementation was subject to significant delays
Following approval of the business case, the PSNI established a PBR Panel which was responsible for considering proposals from business areas, with a view to establishing a long list of viable, cash generating savings proposals from across the full range of the PSNI’s operations by September 2016. However, this stage was subject to delay due to significant variations in the quality of submissions, and a decision taken mid-project to change the process used to select the chosen savings proposals for implementation. As a result, the PSNI was unable to deliver on one of PBR’s key objectives - to generate cash savings proposals in time to make a contribution to the financial management of the organisation from 2016-17.
There was a lack of robust evidence to support proposals
Inadequate management information, coupled with lack of skills and experience, meant that the PSNI did not establish a robust evidence basis to quantify the costs of activities. As a consequence, it did not have a sufficiently accurate picture of the costs of providing individual services and was not able to fulfil its potential as a basis for eliminating costs and improving efficiency.
There was a lack of transparency about selecting the final set of proposals for implementation
It was intended that the PBR panel would make a final decision about which proposals should be selected for implementation, using a selection process which involved systematically scoring each proposal against set criteria including the scale of benefits, risk and cost of delivery. Instead, the panel presented a long list of 77 viable projects to the PSNI’s Senior Executive Team which, over six months of deliberations, was whittled down to a final set of 14 proposals to be implemented. The process was largely subjective rather than evidence based, and leaned heavily on the professional judgement of senior officers.
The PSNI’s main focus has been to reduce expenditure by decreasing the size of the workforce
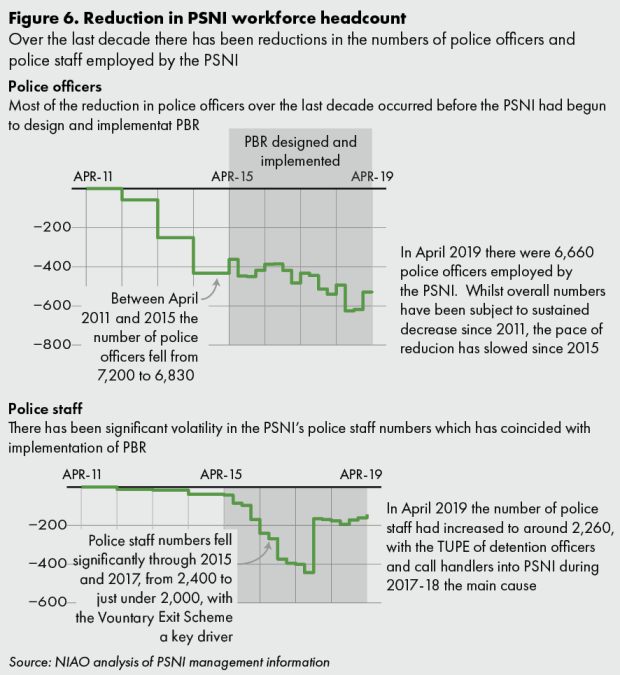
Police officer headcount fell from 7,195 to 6,660, whilst police staff numbers fell from 2,400 to 2,260 between April 2011 and April 2019. This presents a number of risks to long-term sustainability:
- The changes in the workforce are not related to an analysis of the actual number of officers the PSNI needed to deliver an effective service – they are driven solely by the need to meet immediate financial pressures.
- Over time, there is a risk of developing a significant gap between actual staff numbers and the numbers that the PSNI’s analysis suggests it needs.
- There is a relatively low degree of control over the pace of change and it can be difficult to manage the skills base of the organisation as highly skilled, experienced officers depart and the supply of potential replacements becomes more restricted.
There is a lack of evidence of the outcomes delivered by PBR projects
An uncoordinated approach to programme and project management makes it difficult to evaluate success. A consistent pattern of missing target dates for the delivery of projects; rolling forward projects from year to year; limited management information; and subsuming projects into new or other projects makes it highly challenging to monitor progress or to assess the benefits achieved from PBR.
The PSNI’s approach to managing short-term financial pressures has unintended consequences
The reduced headcount has undoubtedly put a strain on the service. Resources for neighbourhood policing, in particular, have reduced. Absences have also increased significantly over the last nine years. The average number of working days lost as a result of sickness absence increased from eight days in 2010-11 to 14 days in 2018-19. The number of PSNI officers on recuperative and adjusted duties has more than doubled over the same period, from six per cent in 2010-11 to 13 per cent in 2018-19.
High levels of sickness absence, increasing levels of demand and the emerging concerns over officer wellbeing are all issues which present significant risks to the future resilience of policing.
Summary of key recommendations
R1 The quality of project initiation is often highly predictive of whether a project will be successful or not. When developing future programmes, the PSNI should ensure that key elements are in place prior to implementation, for example clarity on expected outcomes, costs and benefits, feasibility and appropriate governance.
R2 Future cost reduction or efficiency programmes should be built upon a strong, strategic and evidence based understanding of how resources are used across the organisation, in order to support innovation that can lead to performance improvement and greater efficiency.
R3 Selection of projects for implementation should be underpinned by a documented prioritisation process that compares accurate and realistic assessments of the costs, benefits and delivery risks of each project.
R4 Efficiency or cost reduction programmes should incorporate a tiered corporate governance process that allows for proportionate management of change proposals that emerge.
R5 The design of future cost reduction and efficiency programmes should incorporate effective arrangements for measuring and validating the benefits achieved.
Part One: Introduction
Police services across the UK have been subject to a decade of sustained reductions in funding
1.1 Funding reductions have provoked substantial political and media interest in the risk posed to the quality and sustainability of police services. Between 2010-11 and 2019-20 the PSNI’s regular funding fell from £947 million to £744 million in real terms annually – a decrease of around 20 per cent (Figure 1). In England and Wales funding for police services fell by 18 per cent between 2010-11 and 2017-18, then recovered partially over the next two years, to the extent overall funding levels were 12 per cent lower in 2019-20 than in 2010-11 in real terms. Accordingly, reduced funding in the PSNI has been proportionately more significant than that experienced by other police services.
1.2 In 2018, a review by the National Audit Office covering police services in England and Wales detected indications that the police sector was struggling to maintain service quality due to the prolonged squeeze on funding. In response, the Home Office acknowledged that there was evidence of increasing financial pressure, particularly since 2015, and accepted that a number of police services were at high risk in terms of their future resilience.
The PSNI is one of the largest police services in the UK
1.3 In terms of funding and size, the PSNI is large compared to most other police services in the UK. It is also the most expensive, relative to the size of the population it serves (Figure 2). One of the main reasons for this is the factors associated with the unique political and security environment in which it operates. This includes unique legacy resourcing issues, a terrorist threat which is regarded as ‘severe’ and risks associated with Brexit, (Northern Ireland is now the only part of the UK which has a land border with the EU). These factors have had a significant impact on how the organisation has evolved.
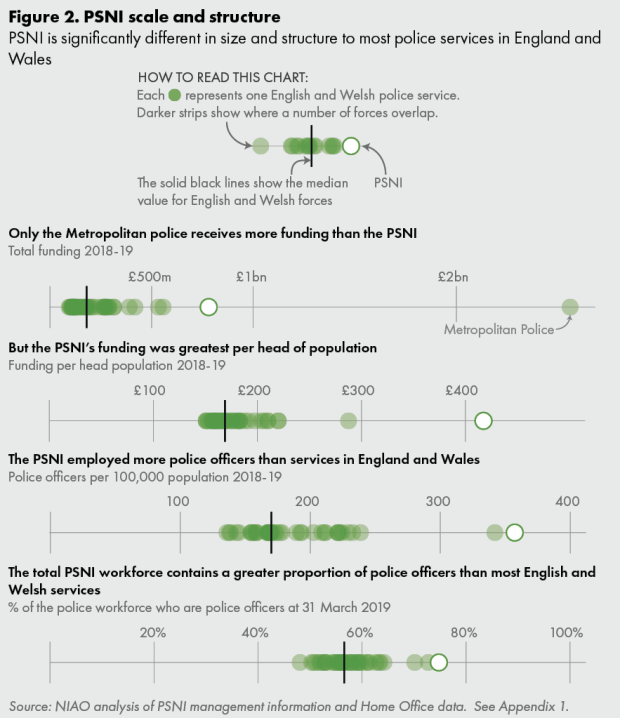
1.4 Most of the PSNI’s funding is used to meet staff related costs – around 70 per cent in 2018-19. These costs consist mainly of the wages and overtime paid to police officers and police staff. At 01 April 2019 the PSNI employed 6,664 police officers and 2,257 police staff. The remainder of the PSNI’s funding is used to procure goods and services that are necessary to support the delivery of an effective policing service. Whilst the reduction in staff costs over the last decade have been larger in outright terms, the reductions applied to non-staff costs have been proportionately more significant (Figure 3).

Since 2010, the PSNI has implemented two major business transformation and cost reduction programmes with a view to establishing a long term strategy for reducing costs and improving service delivery
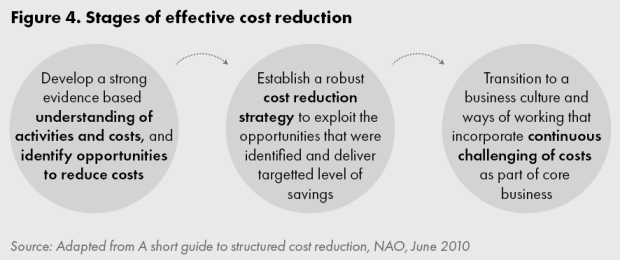
1.5 Maintaining service quality whilst managing prolonged funding reductions is a significant challenge. In reality, there will inevitably be at least some reliance on short-term saving decisions to alleviate immediate financial pressures and budget shortfalls. These decisions are often taken without full consideration of any longer-term consequences. Prolonged dependence on such decisions can therefore pose a threat to the effectiveness and sustainability of the organisation and its ability to deliver high quality services. Protecting service quality and sustainability over the long term, whilst also reducing costs, requires organisations to look beyond immediate short-term savings and think more radically about how costs can be removed from the organisation. Achieving this depends upon developing an informed strategic overview of how the organisation operates, and the relationship between activities, costs and outcomes (Figure 4).
1.6 Over the last decade the PSNI has implemented two major business transformation and cost reduction programmes. Between 2011 and 2015, in cooperation with an external partner, it designed and implemented the ServiceFirst programme which involved transforming a number of organisational processes to improve efficiency. This programme was complete by 2014-15. Between 2015 and 2019 the PSNI then independently identified and implemented another business transformation and cost reduction programme: Priority Based Resourcing (PBR).
Report scope and structure
1.7 The purpose of this review is to assess the effectiveness of PBR as a sustainable cost reduction process. The report provides an assessment on the quality of that process, but does not provide a comprehensive assessment on the current overall sustainability of policing in Northern Ireland.
1.8 The PSNI is in the process of developing a financial plan setting out how it will meet the strategic priorities in the Policing Plan and in its Corporate Plans from 2020-21 until 2022-23. As part of this, the PSNI plans to implement a new interim efficiency programme. This programme will adopt a different approach, to be approved through the PSNI’s Service Change Board. The PSNI recognises the need to learn from the experience gained during 2015 to 2019. To assist with this, our report contains a number of high level recommendations.
1.9 The report is structured in the following way:
- Part Two sets the context by providing an overview of the PSNI’s response to the reductions in funding;
- Part Three assesses the extent to which the planning and implementation of PBR enabled the PSNI to identify opportunities for cost reduction and improved service delivery; and
- Part Four evaluates the extent to which the desired outcomes were achieved.
Part Two: The PSNI’s response to reductions in funding
2.1 This section of the report provides a high level overview of the financial and operational environment and its impact upon the PSNI throughout the planning and implementation of PBR.
Funding reductions in the PSNI have been more significant than those in England and Wales
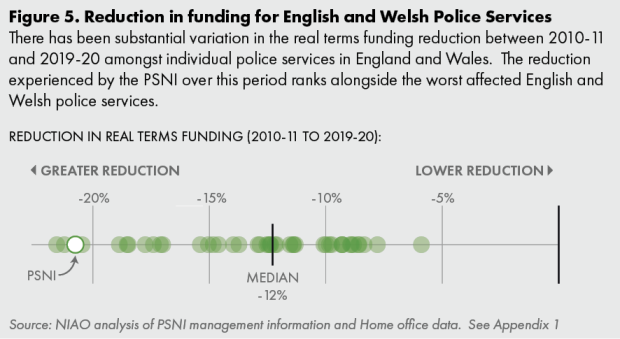
2.2 The regular funding allocation has fallen in real terms from £947 million in 2010-11 to £744 million in 2019-20 – a decrease of around 20 per cent. This is generally higher than the reductions experienced by most police services in England and Wales (Figure 5). Whilst these have varied in scale between individual police services, overall total funding in England and Wales fell by 18 per cent between 2010-11 and 2017-18 in real terms. Since then, there has been a slight recovery to the extent that overall funding levels in 2019-20 were only 12 per cent lower than 2010-11 in real terms. PSNI funding has not benefited from a similar recovery over the last two years.
2.3 Some police services in England and Wales have been able to partially offset funding reductions through utilising cash reserves that had built up during the previous decade. The National Audit Office observed that this had become increasingly prevalent since 2014-15. Due to the different funding arrangements that apply in Northern Ireland, the PSNI is not normally allowed to carry forward underspends from one financial year into the next. As a result, it could not avail of similar significant reserves available to English and Welsh services.
Decreases in the PSNI’s workforce have contributed to reductions in overall expenditure levels
2.4 The most important and high profile trend arising as a result of reduced funding for policing, both in the PSNI and in forces in England and Wales, has been a considerable reduction in the workforce. The police workforce consists of police officers and police staff. In the PSNI, police officer headcount fell from 7,195 to 6,660, whilst police staff numbers fell from 2,400 to 2,260 between April 2011 and April 2019 (Figure 6). The Voluntary Exit Scheme was a key driver behind the reduction in staff numbers, the rules of which precluded re-investment in police staff.
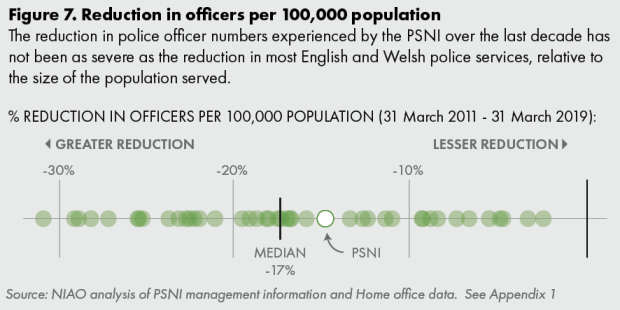
2.5 Whilst reducing officer numbers has made the delivery of policing services more challenging, the scale of the reduction relative to the size of the population served was not as severe for the PSNI as that experienced by most police services in England and Wales over the same period (Figure 7). However, the longer term historical context within which the cuts of 2010-20 were made differs significantly.
2.6 In England and Wales, a sustained increase in police funding over the previous decade produced a significant increase in police officer numbers. Between 2003 and 2010 the number of police officers in England and Wales increased from 133,000 to 144,000. The PSNI’s workforce reductions between 2011 and 2019, however, followed a longer term trend of reducing headcount. Between 2001 and 2011, nearly 4,000 regular police officers and 1,500 full-time reserve officers had left the service, mainly a consequence of the implementation of an early redundancy scheme recommended by the Patten Report.
2.7 Comparing trends of changes in the total number of police staff employed by police services is more problematic than for police officers. The available data suggests that the reduction in police staff within the PSNI since 2011 has been more severe than that of most English and Welsh police services. However, there is substantial variation amongst English and Welsh forces (the number of staff employed has actually increased over the decade in some police services). Furthermore, our ability to compare the PSNI to individual forces is impaired by a limitation in the data for England and Wales, in that it does not record staff employed by private companies contracted by police forces to provide particular services. As a result, there is a significant risk that the data understates the true strength of the police staff workforce in England and Wales, as police services have increasingly turned to contracted staff in recent years.
2.8 Reducing the size of the workforce can help reduce costs, but it is a crude tool that offers limited opportunity to strategically manage the officers who leave the PSNI or the precise timing of their departure. Between 2011 and 2019 it has been implemented through a policy of limiting recruitment below the level of departures, ensuring an overall reduction in the headcount over time.
2.9 This presents a number of risks to long-term sustainability:
- The overall reduction in the workforce achieved is not always directly related to specific analysis of the actual number of officers PSNI needed to deliver an effective service – instead, it is driven mainly by the need to alleviate immediate financial pressures.
- Over time, there is a risk of developing a significant gap between actual staff numbers and the numbers that the PSNI’s analysis suggests it needs.
- There is a relatively low degree of control over the pace of change and it can be difficult to manage the skills base of the organisation as highly skilled, experienced officers depart and the supply of potential replacements becomes more restricted.
Part Three: Planning and implementation of PBR
3.1 This section of the report examines how the PSNI planned and implemented PBR and identifies a number of weaknesses.
PBR was identified as an approach that could deliver potential cash savings in the short term and improved efficiency in the long term
3.2 By 2014-15 the PSNI had effectively completed its previous cost reduction and efficiency programme, ServiceFirst. However, it continued to be subject to significant financial pressures and consequently, the PSNI sought to identify a new programme to help manage these (Figure 8).
The PSNI implemented PBR without fully understanding how it would work
3.3 The PSNI’s adoption of PBR was influenced by two key external factors:
- Annual inspections of UK police services by Her Majesty’s Inspectorate of Constabulary and Fire and Rescue Services (HMICFRS) had begun to place significant emphasis on how deeply they understood the nature of their work, the evolving nature of the demand they faced, and whether they were prioritising and optimising their use of limited resources.
- The PSNI’s engagement with HMICFRS and other police services had suggested that those assessed as performing best within this framework had benefited from implementing Priority Based Resourcing systems to support them.
3.4 The PSNI undertook its initial research into PBR during 2014, and a business plan assessing the feasibility of implementing it was approved by the PSNI’s ServiceFirst Board in June 2015. In general terms, the business case envisaged PBR essentially as being the completion of a substantial analytical exercise, carried out by staff across the organisation, identifying the services delivered by each of the PSNI’s business areas and apportioning total business area costs against those services.
3.5 The methodical analysis and quantification of activities and costs would provide a basis for staff within business areas to question how they were operating, to identify wastage and inefficiency, and suggest new ways of working that had the potential to deliver cash savings and improved efficiency.
3.6 At a corporate level, bringing together the evidence developed by all of the various business areas would support an enhanced understanding of the full range of demands the PSNI responded to. Improvements in this would help the PSNI become more effective in allocating and reallocating staff and other resources between business areas to manage the constantly evolving demands for policing.
3.7 The initial analytical process was intended to be repeatable on a cyclical basis, effectively embedding a new culture which would challenge costs and facilitate optimal utilisation of limited resources (Figure 9).
3.8 The PSNI did not, however, develop a full appreciation of how PBR would work to achieve this vision and deliver benefits before approving its implementation. The business case and other associated planning documents do not demonstrate a clear understanding of what PBR was, or a clear vision of the specific objectives that the programme would achieve. The business case itself contains little detail on these issues and lacks a robust quantification of the full implementation costs or a comparison of how these costs would compare to the anticipated benefits. There was only peripheral involvement of the PSNI’s finance team in the process. In our view, this was a lost opportunity to bring in the professional financial expertise that was necessary to support an effective business proposal
3.9 Minutes from the ServiceFirst Board meeting that approved the business case indicate that there was an expectation that the programme would deliver savings of “around £4 million a year”. However, this objective was not integrated into either the projected outputs or the expected benefits in the business case, and was not subsequently used as a target against which to measure progress/effectiveness during implementation. Instead, the business case contains a number of high level and process-based objectives, and includes reference to an intention to “drive out significant cash releasing savings in 2016-17 and beyond”. The value of these savings is not prescribed, and does not seem to have influenced significantly how PBR was implemented once substantive work began. Assessment of potential risks in the document is general and not based upon a systematic appraisal process.
Recommendation 1
The quality of project initiation is often highly predictive of whether a project will be successful or not. When developing future programmes, the PSNI should ensure that key elements are in place prior to implementation. This includes:
- clarity on the overall priorities and desired outcomes of the programme;
- an appreciation of the full cost of delivery and recognition of areas of potentially significant optimism-bias;
- a robust assessment of the feasibility of delivering what is planned; and
- a governance structure and processes that will ensure that focus is maintained on delivering the original priorities of the programme.
3.10 The business case lacks a detailed timeframe with key milestones for delivery and realisation of benefits. Instead, developing such a plan is included as a projected output of the delivery of PBR. Whilst the ServiceFirst Board requested a detailed process map, what was provided did not constitute an adequate plan for a project as strategically important as PBR. The absence of important components of an effective plan made it highly likely that the implementation of PBR would be adversely affected by delays and changes in scope.
Implementing PBR took significantly longer than planned and as a result expected benefits were delayed
3.11 Following approval of the business case, the PSNI established a PBR Team which was responsible for planning and implementing the process. This work involved:
- establishing Terms of Reference defining how PBR would work in practice;
- developing a suite of standardised forms for use by business areas completing and recording their analysis of costs and services; and
- delivering training to business areas to ensure they were capable of performing this role.
The PBR Team was also available to provide support to business areas which encountered difficulties whilst they completed their work.
3.12 Once business areas had completed their analysis and developed change proposals, it was intended that they should present these to a series of PBR Panel sessions during 2016. The Panel would consider all submissions, with a view to establishing a long list of viable cash generating savings proposals from across the full range of the PSNI’s operations by September 2016. However, this stage of the process was subject to significant delay (Figure 10).
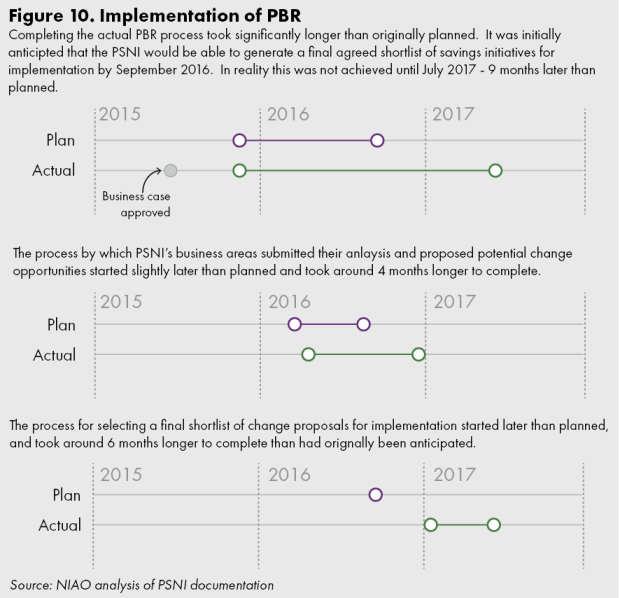
3.13 There were significant variations in the quality of submissions initially presented by business areas to the early Panel sessions. As a result, a number of business areas were requested to revisit their initial work and resubmit their initial analysis and savings proposals. It is also clear that the PSNI had underestimated the intensive time and effort required to complete the analysis. For the purposes of PBR, the PSNI was divided into 90 separate business units, each of which was required to deliver a presentation to the Panel. This imposed a huge administrative burden. Due to the significant time commitment, the Panel’s membership tended to be on a rotational basis and consequently lacked consistency.
3.14 As the project progressed, a decision was taken to change the process used to select a final set of savings proposals for implementation. The initial plans had anticipated that the PBR Panel would be responsible for the selection of a final set of projects for implementation. The Panel would assess whether each individual proposal was viable on its own terms, and then rank the viable proposals according to a range of criteria (which included quantifying the expected benefits and level of risk involved). From this ranked list, the Panel would then select a set of projects for immediate implementation based upon the level of financial need, whilst reserving those projects not selected for potential future implementation, depending upon subsequent business and financial needs and their continued viability.
3.15 Instead, the Panel got as far as collating a long list of 77 projects that were considered to be individually viable. This long list was then passed to the PSNI’s Senior Executive Team (SET) in late 2016, which assumed responsibility for selecting a set of proposals to be implemented. Rather than the relatively quick final selection process that had been planned, the SET’s deliberations and negotiations on the projects took around 6 months to complete, selecting in July 2017 a set of 14 proposals to be implemented.
3.16 The main implication of this delay was that the PSNI was not in a position to deliver on one of the key objectives of PBR – generating cash savings proposals to begin making a contribution to the financial management of the organisation from 2016-17. Instead, projects that were approved in mid-2017 had to be implemented during 2017-18. As a result, any financial impact would be in 2018-19, two years later than planned.
There was a lack of robust management information to inform decisions
3.17 The intention was for a substantial and comprehensive, organisation-wide analysis of activities and costs, to provide the basis for a wide range of potential change proposals that could deliver cash savings or improved efficiency. Reliance would be placed upon business areas using their domain expertise to measure costs and identify opportunities for improvement. The PBR Panel would scrutinise and challenge the proposals made by business areas and the underlying analysis, to provide assurance over its quality and test the feasibility of what was proposed.
3.18 However, this ambition was not achieved. Documentary records do not provide a sufficiently detailed analysis of performance or of a robust challenge to provide adequate assurance about the viability of proposals. Three key issues affected the quality of the evidence base:
- Delegation of responsibility for undertaking and recording the results of analysis to business areas resulted in work being carried out by staff who were not always skilled to undertake this task. Consequently, the information documented does not provide a strong evidence base upon which to build a cost reduction programme.
- It proved challenging for teams to gather accurate and reliable performance data. The business areas identified for PBR purposes did not match the organisational structure used in key management information systems, making it difficult for business areas to define activities and obtain useful data.
- These issues (above) were not identified or remedied effectively by the PBR Panels. There is a consistent view within the PSNI that the Panel applied a robust challenge and it was an uncomfortable experience for those appearing before it. Poor quality presentations were subject to significant criticism and further work was required prior to resubmission. However, there proved to be a high attrition rate amongst the proposals eventually selected for implementation. In some cases, the decision to abandon these proposals after their selection related to viability issues that should have been identified by a robust appraisal process.
3.19 These issues meant that the PSNI struggled to establish an accurate and detailed understanding of the costs of providing individual services and without this, PBR could not fulfil its potential for eliminating costs and improving efficiency.
Recommendation 2
Future cost reduction or efficiency programmes should be built upon a strong, strategic and evidence based understanding of how resources are used across the organisation, in order to support innovation that can lead to performance improvement and greater efficiency.
It is important that any analysis carried out at business area level is supplemented by higher level analysis that also measures costs and activities that cross business area boundaries. This supplementary analysis should help to identify potential savings that may otherwise be missed with a lower level focus, or instances where savings in one area result in displacement of costs elsewhere in the organisation.
It is also important that analysis not only quantifies the cost of activities or services, but also seeks to establish a view of what these should cost. This will provide an effective means of setting targets which can stimulate proposals and innovations. It is likely that the PSNI will need to benchmark the cost of its activities or services internally (between business areas) and externally (in partnership with other police services).
Developing the evidence base required to facilitate this understanding will require that information held across various management information systems can be aligned. It also requires that the work involved in collating and analysing performance data is undertaken by appropriately skilled staff.
It is not clear how a final set of proposals was selected for implementation or how they would generate long term efficiencies
3.20 The PBR Panel did not make a final decision about which proposals should be selected for implementation. Instead, it presented a long list of 77 viable projects to the PSNI’s SET which, over six months of deliberations, selected a final set of 14 proposals to be implemented.
3.21 Under the initial model there had been plans for the selection process to involve a systematic scoring of each proposal against set criteria, including scale of benefits, risk and cost of delivery. The intention was that a desired outcome would be specified and the top ranking group of projects needed to deliver this level of benefit would be selected. This would be an objective and mechanistic process that, if followed, should have left a clearly documented audit trail justifying the selection made, that could be replicated in the future.
3.22 This selection process was not used by the SET. Instead, the selection process came to rely heavily upon the professional expertise of the senior officers who debated the proposals they were presented with. There was a lack of documentation covering this stage of the process. As result, there is no evidence that the final selection was based on the systematic and robust appraisal process that is necessary to the PBR process.
Recommendation 3
Selection of projects for implementation should be underpinned by a documented prioritisation process that compares accurate and realistic assessments of the costs, benefits and delivery risks of each project.
Quantitative evidence may be supplemented by qualitative evidence which incorporates some degree of professional judgment, but it is essential that the documentary record details the appraisal process and the rationale applied during decision-making.
In the context of cost reduction, there should be a clear distinction between proposals intended to be cash-releasing and those focused more on improving operational performance or efficiency.
There is a lack of evidence of the outcomes delivered by PBR projects
3.23 Of the 14 projects initiated in late 2017, by October 2019 three had been completed, with the remainder either abandoned or subject to significant changes. The three completed projects were also subject to substantial changes in scope during implementation.
3.24 This rate of attrition is a symptom of projects receiving approval on the basis of incomplete proposals and plans. At least two proposals selected for implementation and subsequently abandoned should not have passed a robust appraisal process. For example, a proposal to reduce the crews of Armed Response Vehicles from three officers to two was abandoned because it was not compliant with national standards and would result in the invalidation of the PSNI’s training licence, amongst other reasons.
3.25 This uncoordinated approach reflects a more pervasive weakness. Over a number of years our work has highlighted issues over programme and project management arrangements and the need to ensure that they are effective in supporting the delivery of important corporate programmes. The consistent pattern of missing target dates for the delivery of projects; rolling forward projects from year to year; limited management information; and subsuming projects into new or other projects makes it difficult to monitor progress and is indicative of continuing issues around the PSNI’s project management. It also weakens the PSNI’s arrangements to measure and report the benefits derived from its programmes and projects.
3.26 There is an acceptance that the PSNI did not appreciate fully the distinction between truly significant change projects and those ‘business as usual’ decisions taken in response to a particular pressure or circumstance, and to embed this distinction within project management arrangements. Instead, managers often applied a ‘one size fits all’ approach to project management which was not always appropriate and did not help project delivery.
3.27 Within the context of PBR, the initial proposals offered a wide variety of different ideas, which had the potential to differ significantly in terms of scale, cost, time and complexity. However, the implementation of PBR and the process used to select projects lacked the sophistication to allow for a tiered and proportionate governance model to be used.
Recommendation 4
Efficiency or cost reduction programmes should incorporate a tiered corporate governance process that allows for proportionate management of change proposals that emerge.
Part Four: Measuring the outcomes of PBR
4.1 Part Four considers the outcomes so far from the PBR process. It identifies some significant implications for long term sustainability and service delivery.
Despite prolonged and significant cost reductions overall crime outcome rates have remained stable and confidence in the PSNI has increased over the past decade
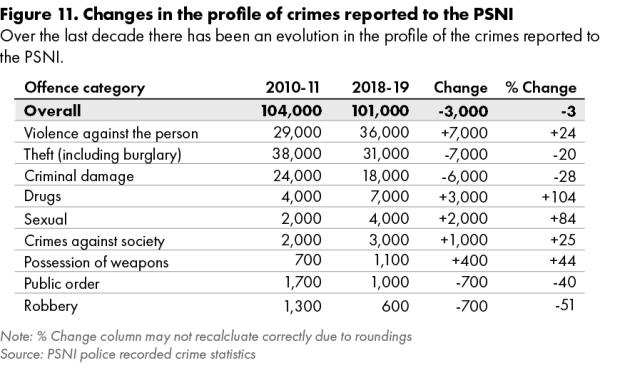
4.2 As funding and staffing levels decreased, the demands placed upon the PSNI by the community increased. In 2010-11 PSNI recorded a total of 491,000 incidents reported by the public – in 2018-19 this had increased to 568,000. A key driver has been calls linked to non-crime related incidents, for example incidents of emotional crisis in the community. There is a widespread view that reduced funding in other areas of public services, particularly health and local government, has displaced costs and demand onto the police. This increase in recorded incidents is not associated with a similar increase in crimes recorded by the PSNI. Overall, crime levels have remained relatively stable although there has been a change in the profile of the offences being recorded (Figure 11).
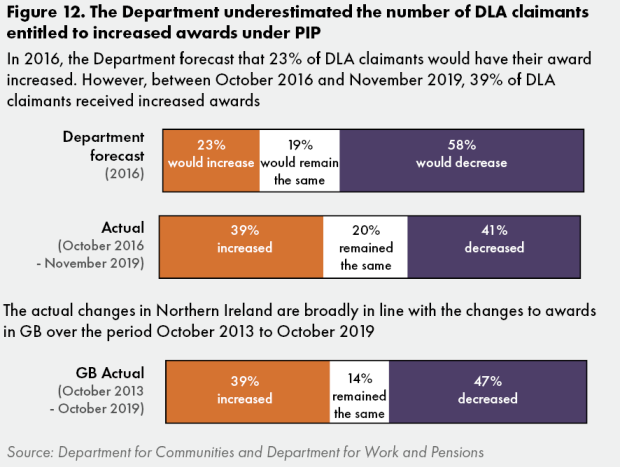
4.3 Despite the changing profile of reported crimes, the PSNI has maintained a consistent overall outcome rate. In 2018-19, the PSNI delivered an outcome in around 28 per cent of all crimes recorded – which is 1 percentage point higher than the outcome rate in 2010-11. As with recorded crime offence type trends, there is a divergence in the change in outcome rates for different offences (Figure 12).
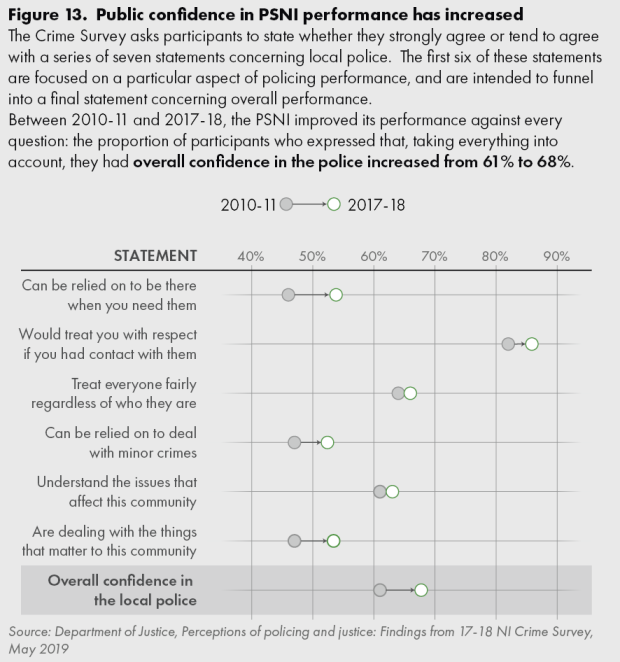
4.4 The main measure of public confidence in the PSNI is through the Crime Survey which contains a number of questions focused on tracking changes in public attitudes towards the effectiveness of the police. Whilst some measures used are specific to Northern Ireland, the survey contains two sections that are directly comparable to similar questions asked in England and Wales.
4.5 One of these involves asking participants the extent to which they agree to six statements covering different areas of policing performance, followed by a final overall statement that, taking everything into account, the participant has overall confidence in the police. Over the last decade the survey has shown that public confidence in the PSNI has been increasing against each of the statements used in the survey (Figure 13). This trend of overall improvement is also evident in the other sections of the survey that deal with policing.
4.6 Despite improvement, public confidence in the PSNI is still significantly lower than public confidence in policing measured in England and Wales. This has been a long-term trend and it is likely that the unique, historical security environment in which the PSNI operates remains a significant factor.
PBR did not provide a source of short-term cash saving change proposals that could be used to help deliver annual balanced budgets
4.7 After the completion of the PBR process and approval of a set of change proposals for implementation, the PSNI established a PBR Programme Board. The Board had two main responsibilities:
- overseeing business area implementation of the 14 PBR projects approved by the SET; and
- responsibility for the reallocation of officers and staff between business areas to enable the PSNI to manage evolving demands and pressures.
4.8 The PSNI’s intention was that PBR would provide a strategic framework to help guide, at least in part, difficult short term financial decisions that had to be taken to deliver a balanced budget. It would make this contribution through the identification of a number of quick win savings that would begin to have a financial impact from 2016-17. At the ServiceFirst Board it had been stated that these savings should be in the region of £4 million, year on year, over a three year period (see paragraph 3.9). However, a strong focus on delivering against this objective was not maintained through the project. There is little evidence to suggest that any of the short-term savings made by the PSNI in order to deliver balanced budgets between 2015 and 2019 can be directly traced to the work carried out during the PBR exercise.
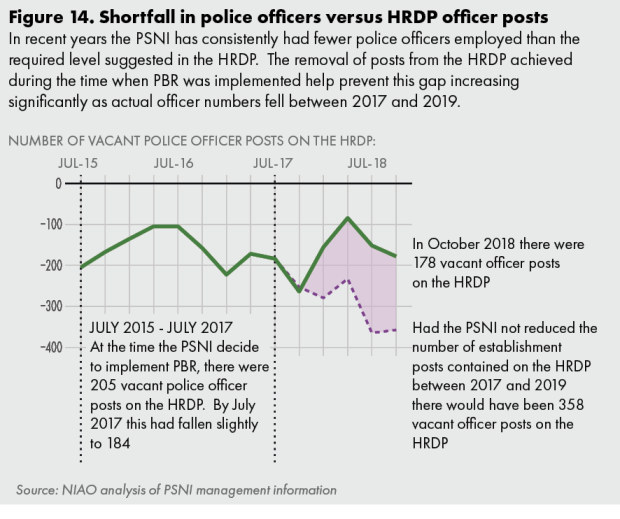
4.9 Arguably, the main reason for this is that the set of proposals adopted by the SET were not cash releasing change projects. Instead, the changes proposed and implemented were related primarily to the reallocation of posts within the PSNI’s Human Resource Distribution Plan (HRDP). The HRDP is essentially a mapping document used to document PSNI’s current best estimate of the number of police officers and police staff needed to provide an effective policing service (“establishment posts”), the allocation of these posts between the different business areas of the PSNI, and a quantification of the difference between posts allocated to each area and the number of actual staff in post.
4.10 In July 2017, when the 14 projects were approved by the SET, it was anticipated that their implementation would result in a reduction of 285 police officer establishment posts within the HRDP. Whilst important, these changes would not deliver cash savings because in many instances the posts were removed from business areas which did not have a full staffing compliment and the post was already vacant. Even where a police officer was currently allocated to one of these posts, they would be transferred into another area as a result of the elimination of that role. Whilst there may have been cost savings in particular business areas, there was no overall saving for the PSNI as a whole.
4.11 The absence of cash generating saving proposals severely limited the benefits that PBR could deliver. It meant that it could not fulfil its potential as a tool to help minimise high risk short-term top-slicing of budgets to alleviate financial pressures.
It is not possible to quantify the contribution that PBR made to a more efficient allocation of staff within the PSNI
4.12 In Part Two and at Figure 6 we illustrated how actual police officer numbers in Northern Ireland fell throughout the 2010-2019 period. Although the pace of this decrease had slowed, PBR was implemented in an operational context of continued reducing officer headcount. At the time the SET approved the PBR project proposals in July 2017, the PSNI had around 200 fewer actual police officers in post than the number of establishment posts identified in the HRDP. This gap between actual staff and establishment posts represents a risk to the quality of policing services and the PSNI’s long-term sustainability.
4.13 The PSNI and the PBR Programme Board eliminated a total of 297 posts from the HRDP between 2017 and 2019. This reduction in establishment posts meant that the gap between the number of actual staff in post and establishment posts did not grow significantly as actual staff numbers fell in those years. (Figure 14).
4.14 The reduction in establishment posts was generally in line with the reduction anticipated from implementing the PBR projects. It was achieved despite the high attrition rate amongst the 14 projects. However, this does not reflect the success of PBR. Instead, it is attributable to the decisions made by the PBR Programme Board rather than a consequence of the programme. The Programme Board imposed reductions in the number of establishment posts within specific business areas and required management to develop a way of working to accommodate this new ceiling. In some cases, new posts were allocated to business areas upon the submission of a detailed application to the Programme Board.
4.15 Consequently, it is difficult to quantify the impact or the influence that PBR had on these decisions and outcomes. There is, however, a consistent view within the PSNI that the way the Programme Board dealt with business areas was consistent with the objectives of PBR – that there was a demand for robust evidence to justify the need for resources and a strong challenge to unevidenced assumptions.
4.16 Nevertheless, the PSNI cannot clearly demonstrate a link between the PBR process and the impacts achieved through the activity of the PBR Programme Board. An important weakness was the absence of monitoring processes to track the impacts being achieved during PBR implementation against the original objectives. This weakened accountability and did not incentivise officers and staff to deliver the objectives. In our view, the lack of strong incentives was a likely contributing factor to the loss of focus on one of PBR’s main objectives early on in the process: the achievement of short-term cash generating savings proposals.
4.17 Without effective monitoring arrangements, it is difficult to demonstrate that the outcomes achieved by the PBR Programme Board’s decisions were part of a larger strategic programme. Any comprehensive assessment of the value of PBR requires the PSNI to show that the actions undertaken were guided by the use and further development of the evidence base initially established by the PBR Panel process, as opposed to being an accumulation of day to day reactive management decisions in response to emerging pressures over an 18 month period.
4.18 There has been no comprehensive assessment to determine that the changes made during the PBR period represent true long-term efficiencies. This would require a process that monitored the impact of the changes made over a sustained period, quantifying the benefits derived and validating that these benefits had been sustainable over a reasonable period of time. Without this, the PSNI cannot demonstrate that PBR has delivered value for money.
Recommendation 5
The design of future cost reduction and efficiency programmes should incorporate effective arrangements for measuring and validating the benefits achieved as the result of actions taken within the programme. These arrangements should ensure that the PSNI is able to:
- quantify any benefits that result from the activities completed as opposed to no action being taken; and
- measure these benefits against their implementation costs and assess any significant variations in costs or benefits from those originally anticipated.
Completion of post-project evaluations within a specified timescale will be an important part of this process. However, it is also important that there is a longer-term review process to ensure that the changes implemented and benefits and savings achieved have been sustainable.
The PSNI’s approach to top-slicing budgets in response to short-term financial pressures has unintended consequences
4.19 In general, non-staff costs have offered greater short-term flexibility to the PSNI than staff costs in terms of achieving savings quickly. Whilst the degree of control and flexibility varies, a number of areas of non-staff costs have offered the ability to “top-slice” expenditure at short notice to ease projected financial pressures.
4.20 This has been particularly important since 2014-15 as the PSNI has experienced an environment of greater long term financial uncertainty. On a number of occasions, annual funding allocations have only been confirmed after the financial year has commenced and adjustments have been made to the opening funding allocation mid-year. This has often left the PSNI with an urgent need to reduce planned expenditure levels in a relatively short space of time to ensure annual expenditure limits were met.
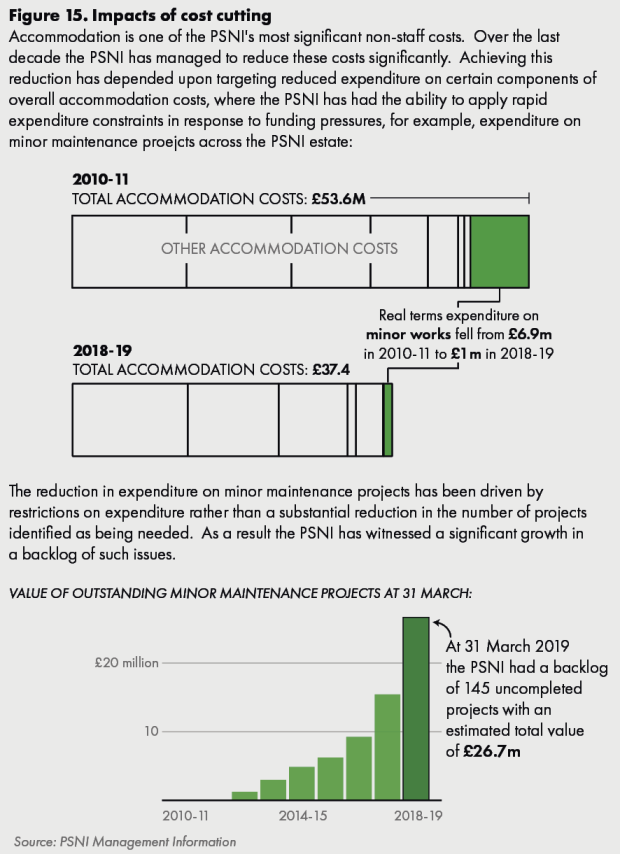
4.21 Analysis of non-staff expenditure shows significant reductions across all areas. Whilst essential in helping the PSNI live within its means, there is a view that variable costs have been trimmed to the extent that no further scope for savings exists, leaving only fixed costs to be addressed further. Any more reductions are likely have a noticeable impact upon the PSNI’s ability to deliver a quality service.
4.22 There is a risk that top-slicing budgets to impose immediate expenditure restrictions may result in longer term issues. For example, Figure 15 shows how the restrictions to expenditure on remedying minor accommodation issues have contributed to the development of a significant backlog of jobs requiring large investment to resolve.
Officers have come under pressure to maintain service delivery
4.23 Police officer headcount fell from 7,195 in April 2011 to 6,660 in April 2019 (see paragraph 2.4). We highlighted the strategic risks that the reduction in headcount posed to the PSNI at paragraphs 2.8 and 2.9. In operational terms, reducing numbers of officers has had a significant impact on neighbourhood policing. Newly employed and trained police officers begin their service working within neighbourhood teams. From there, having gained suitable experience, officers can apply for transfer or promotion to other more specialist areas of policing. The reduction in the number of recruits, and the need for staff to be allocated to other critical emerging business areas, has created a significant pressure on neighbourhood policing in recent years. The PSNI has responded to this by announcing the creation of 400 new neighbourhood policing posts by March 2020, funded through EU Exit related funding and reprioritisation of existing posts.
4.24 Reduced officer numbers, combined with the 15 per cent increase in incidents reported over the same period (see paragraph 4.2), has brought police officers under greater pressure to maintain service delivery. This has undoubtedly put a strain on the service. It is, perhaps, not surprising that absences have increased significantly over the last nine years. The average number of working days lost as a result of sickness absence increased from eight days in 2010-11 to 14 days in 2018-19. To put this in context, the proportion of officers on long term sick leave in 2018-19 across the 43 forces in England and Wales was 1.9 per cent and was fairly consistent over the nine year period from 2010-11 to 2018-19. In Northern Ireland, the proportion was higher, at 3.6 per cent. The number of PSNI officers on recuperative and adjusted duties has more than doubled over the same period, from 6 per cent in 2010-11 to 13 per cent in 2018-19.
4.25 High levels of sickness absence, rising levels of demand for policing and increasing concerns regarding officer wellbeing are all issues which present significant risks to the future resilience of policing. These have to be tackled if service delivery is to be maintained in the coming years.
Appendix 1: Key data sources
Figure 1
Confirmation of final resource DEL and capital DEL funding allocations for years 2010-11 to 2018-19 and opening allocation for 2019-20 were confirmed by the PSNI.
Figure 1 is based upon Resource DEL allocation only, adjusted to reflect the impact of extraordinary events that distort comparisons between years and for which the PSNI received funding support that would not otherwise have been available. The PSNI agreed that the value of these adjustments should be based upon the actual expenditure incurred against each event within each year as reported in annual management accounts.
All prices were restated to 2019-20 prices using GDP deflators as at June 2019.
Resource DEL
|
Year |
£ MILLION |
||||
|---|---|---|---|---|---|
|
Nominal allocation |
Adjustment |
Adjusted nominal allocation |
Deflator |
Real terms allocation |
|
|
2010-11 |
903,600 |
(90,249) |
813,351 |
87.584 |
947,216 |
|
2011-12 |
849,200 |
(66,954) |
782,246 |
88.736 |
899,165 |
|
2012-13 |
818,100 |
(26,954) |
791,146 |
90.522 |
891,453 |
|
2013-14 |
848,700 |
(53,782) |
794,918 |
92.183 |
879,564 |
|
2014-15 |
760,800 |
(291) |
760,509 |
93.367 |
830,820 |
|
2015-16 |
735,400 |
(184) |
735,216 |
94.114 |
796,813 |
|
2016-17 |
743,500 |
(126) |
743,374 |
96.258 |
787,710 |
|
2017-18 |
732,300 |
(14) |
732,286 |
98.199 |
760,623 |
|
2018-19 |
736,800 |
0 |
736,800 |
100 |
751,529 |
|
2019-20 |
744,200 |
0 |
744,200 |
101.999 |
744,200 |
Adjustments to Resource DEL
|
Year |
£ MILLION |
|||||
|---|---|---|---|---|---|---|
|
Hearing Loss |
Patten Compulsory Severance |
Patten Non Severance |
Patten Voluntary Severance |
G8 |
Total |
|
|
2010-11 |
12,927 |
24,888 |
15,079 |
37,355 |
0 |
90,249 |
|
2011-12 |
21,276 |
33,354 |
0 |
12,324 |
0 |
66,954 |
|
2012-13 |
24,899 |
830 |
0 |
688 |
0 |
26,417 |
|
2013-14 |
10,781 |
481 |
0 |
220 |
42,300 |
53,782 |
|
2014-15 |
0 |
232 |
0 |
59 |
0 |
291 |
|
2015-16 |
0 |
163 |
0 |
21 |
0 |
184 |
|
2016-17 |
0 |
117 |
0 |
9 |
0 |
126 |
|
2017-18 |
0 |
7 |
0 |
7 |
0 |
14 |
|
2018-19 |
0 |
0 |
0 |
0 |
0 |
0 |
|
2019-20 |
0 |
0 |
0 |
0 |
0 |
0 |
Hearing Loss adjustment is based upon total Hearing Loss expenditure per annual management accounts, less £12 million. The PSNI reported that the first £12 million of annual costs relating to Hearing Loss had to be met through regular funding, with additional costs met through additional specific funding.
Figure 2
Total force funding 2018-19
Total funding for English and Welsh forces reported annually by the Home Office. The explanatory document which accompanies these figures explains full detail of the composition of overall funding. Due to its unique characteristics, we have excluded City of London police from these and all subsequent plots in the figure.
Funding allocations for the PSNI confirmed directly by the PSNI. As the notes which accompany the Home Office figures for England and Wales stated that they included police capital funding the PSNI’s reported funding in this figure is based upon total DEL funding for both years – resource DEL and capital DEL.
Funding per head of population
Population figures for each police force area in England and Wales relating to 2018-19 year provided directly by Home Office.
Northern Ireland population figures for 2018-19 sourced from Office of National Statistics.
Police officers per 100,000 population
The number of police officers employed by each police force in England and Wales is reported annually by the Home Office.
The number of police officers employed by the PSNI confirmed by the PSNI.
Workforce composition
Total police staff numbers for England and Wales sourced from same document as police officer numbers. We have included Police Staff, PCSOs and Designated Officers in our calculation of the total number of police staff for each force.
PSNI staff numbers confirmed by the PSNI.
Figure 3
Analysis of PSNI expenditure trends based upon analysis of the PSNI’s annual management accounts. Total outturn in each year subject to adjustments detailed in commentary on Figure 1.
Figure 5
Trend for PSNI calculated using same data, and subject to same adjustments, as that used for Figure 1.
Funding levels for English and Welsh services in 2019-20 detailed in Home Office publication used for Figure 2. Funding levels for 2010-11 were reported by National Audit Office – we confirmed these were compiled on the same basis.
Figure 7
Data for PSNI confirmed by PNSI HR. Data for English and Welsh services sourced from 2010-11 and 2018-19 annual Home Office publications.